

In a classic paper published at 2011, Hadley Wickham asked
What do we do when we analyze data? What are common actions and what are common mistakes?
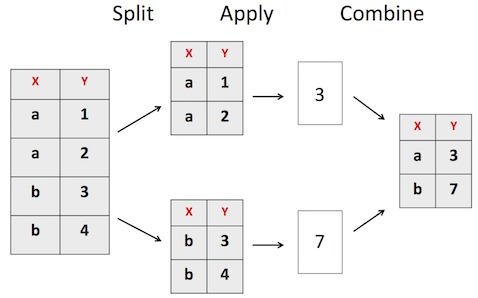
And then went ahead to spell it out one of the most common strategies, Split-Apply-Combine, that is used in common data analysis.


Analysis, Hadley Wickham
Intuitively, while solving a big problem, we typically “Split” the big problem into smaller pieces and solve/apply each small piece and then put back the results (“Combine”) together. In the must read paper, he offered a smooth computational solution to this Split-apply-combine approach, “without having to worry about the type of structure in which your data is stored.” as the R package plyr.
Let us see a quick example of Split-Apply-Combine using Pandas dataframe in Python. Let us first load the packages needed.
# import pandas
>import pandas as pd
# import numpy
>import numpy as np
Let us get the gapminder data from software carpentry URL and load it as pandas dataframe.
# link to gapminder URL
gapminder_csv_url ='http://bit.ly/2cLzoxH'
# load the gapminder data into pandas dataframe
gapminder = pd.read_csv(gapminder_csv_url)
print(gapminder.head(3))
groupby():Splitting the data into groups
Let us first split the data frame into smaller groups by using pandas groupby function. groupby takes in one or more input variables from the dataframe and splits it into to smaller groups.
The gapminder data has lifeExp, population, and gdp information for countries over multiple years. Let us groupby the column variable ‘year’. We can see that the dataframe after applying groupby is a DataFrameGroupBy object under the hood.
>gapminder.groupby('year')
pandas.core.groupby.DataFrameGroupBy object at 0x11267f550
Apply and Combine: apply a function to each group and combine into a single dataframe
After splitting the data one of the common “apply” steps is to summarize or aggregate the data in some fashion, like mean, sum or median for each group. Let us see an example of applying mean function and get average values per year.
>(gapminder
 .groupby('year')
 .mean())

        pop	lifeExp	gdpPercap
year
1952	2.406957e+09	6966.18200	5.289892e+05
1957	2.664405e+09	7314.05096	6.105160e+05
1962	2.899783e+09	7612.51336	6.710654e+05
...
...
...
Aggregation is not the only operation that one can do with grouped object. One can also use the grouped objects to do some transformation or filter each group based on some condition.
In addition, pandas allow us query the grouped object for each query. For example, in the last example, we grouped the dataframe based on the year. We can specify a year and get the smaller data frame for the year using get_group() function. For example, we can get the grouped data frame for the year 1952.
gapminder_1952 = (gapminder
                  .groupby('year')
                  .get_group(1952))

gapminder_1952

	country	year	pop	continent	lifeExp	gdpPercap
0	Afghanistan	1952	8.425333e+06	Asia	28.801	779.445314
12	Albania	1952	1.282697e+06	Europe	55.230	1601.056136
24	Algeria	1952	9.279525e+06	Africa	43.077	2449.008185
...
...
...
We can work with the smaller dataframe. For example, we can groupby continent and get mean values for each continent at year 1952.
(gapminder_1952
 .groupby('continent')
 .mean())

	     pop	lifeExp	gdpPercap
continent
Africa	4.570010e+06	39.135500	1252.572466
Americas 1.380610e+07	53.279840	4079.062552
Asia	4.228356e+07	46.314394	5195.484004
Europe	1.393736e+07	64.408500	5661.057435
Oceania	5.343003e+06	69.255000	10298.08565

