

Sometimes, when one is making boxplot with ggplot2, one might like to order the boxes in a boxplot in a specific way. For example, one might want to sort the boxes in boxplot in ascending or descening order based on the mean or median values of groups in the boxplot. Reordering boxplots can reveal the pattern in the data quickly.

In this post, we will see how to reorder boxplots made with ggplot2 in R.

Let us load the packages we need to reorder the boxplots.
library(tidyverse)
library(gapminder)
library(forcats)
Let us take quick look at the data in our gapminder dataframe.
print(head(gapminder,n=3))

country . year . pop . continent . lifeExp . gdpPercap
<fctr> . <int> . <dbl> . <fctr> . <dbl> . <dbl>
1	Afghanistan	1952	8425333	Asia	28.801	779.4453
2	Afghanistan	1957	9240934	Asia	30.332	820.8530
3	Afghanistan	1962	10267083	Asia	31.997	853.1007
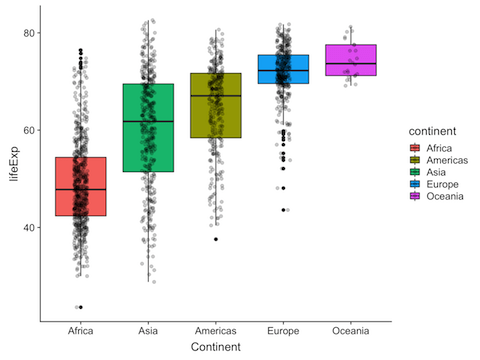
Making beautiful boxplots using ggplot2 is really easy. Let us make a boxplot visualizing the distribution of life expectancy across the five continents from gapminder data.
We will use the pipe operator to feed the gapminder data frame to ggplot, where we specify the aesthetics varaibles x, and y. In this case, we want continent on x-axis and lifeExp on y-axis. We will add the geom_boxplot layer and geom_jitter layer to actually see the data points on a boxplot.
gapminder %>%
  ggplot(aes(x=continent,y=lifeExp,fill=continent)) +
  geom_boxplot() +
  geom_jitter(width=0.1,alpha=0.2)
Simple Boxplots in R

The above boxplot looks great, but one might notice that the continents on x-axis is ordered by alphabets. Sometimes one might want to see the continent variable ordered such that continent with lower life expectancy comes first and the continent with higher life expectancy comes last. Basically, we are interested in ordering the factor variable by another variable. In this case, ordering continents by values of life expectancy.
There are at least two ways to reorder the factor variable, i.e. boxplot with ggplot2. Since we are dealing with categorical variable or factor variable on the x-axis of our boxplot, we have to think about the levels available for the categorical variable.
How To Reorder Boxplots in ggplot2 with forcats
It used to be such a pain to re-order the factor variable when using base-R, where one has to manually specify the order of the variable’s levels.
However, with the package forcats – “for categorical variables”, it is really easy to reorder factor levels by sorting along another variable and thus reorder the boxplots the way want.
The function fct_reorder in forcats package will help us to reorder factor variable and thus the boxplots. With fct_reorder we can reorder one factor variable based on another variable.
The function fct_reorder takes two arguments fct_reorder(continent,lifeExp); first is the factor variable we want to order and the second is the variable we would like to order the factor variable. In this example, we order continents by lifeExp.
gapminder %>%
  ggplot(aes(x= fct_reorder(continent,lifeExp), y=lifeExp, fill=continent)) +
  geom_boxplot() +
  geom_jitter(width=0.1,alpha=0.2)  +
  xlab("Continent")
Now you can see that our boxplot is ordered the way wanted. Continents with lower life expectancy are at the beginning. By default, fct_reorder orders in ascending order.
How To Reorder Boxplots in ggplot2 with forcats in descending order?
In above example, forcats reorders the boxes in ascending order by default. We can change the order of the factor variable to descending order using the argument .desc=TRUE inside fct_reorder().
gapminder %>%
  ggplot(aes(x= fct_reorder(continent,lifeExp, .desc=TRUE), y=lifeExp, fill=continent)) +
  geom_boxplot() +
  geom_jitter(width=0.1,alpha=0.2)  +
  xlab("Continent")
And we get the boxplot ordered in descending order.


We used fct_reorder() function from forcats package for reordering the factor levels. We can also use reorder() function from base R to reorder the boxes. Check out here for examples of using reorder() function from base R to reorder boxplots.
How to Make Horizontal boxplots with coord_flip() in ggplot2
When we have more categorical/factor variables in our boxplot visualization, the traditional way of having the factor variable on x-axis may not work well. A nice trick dealing with a lot of factor variables is to flip the co-ordinates, i.e plot the factor variables on y-axis instead of on x-axis. ggplot2 offers neat trick function coord_flip() to do that.
Let us try flipping the co-ordinates with coord_flip()
 gapminder %>%
  ggplot(aes(x=fct_reorder(continent,lifeExp),y=lifeExp,fill=continent)) +
  geom_boxplot() +
  geom_jitter(width=0.1,alpha=0.2) +
  xlab("Continent") +
  coord_flip()
Now we get


