• Skip to secondary menu
  • Skip to main content
  • Skip to primary sidebar

Python and R Tips

Learn Data Science with Python and R

  • Home
  • Python
  • Pandas
    • Pandas 101
  • tidyverse
    • tidyverse 101
  • R
  • Linux
  • Conferences
  • Python Books
  • About
    • Privacy Policy
You are here: Home / R / Data Visualization / Data Visualization with R, A New Online Book

Data Visualization with R, A New Online Book

January 24, 2018 by cmdlinetips

Fundamentals of Data Visualization
Just recently wrote a post on 13 awesome Free Books to learn Data Science and R. And that did not last long. It is not just 13 anymore :). It is time to update the list of awesome data science books/resources available online freely.

Claus Wilke, a professor from UT Austin has just announced a new book on data visualization, one of the important aspects of data science or science for that matter. The book is currently titled “Fundamentals of Data Visualization” and will be published by O’Reilly.
An early version of the book is available freely online http://serialmentor.com/dataviz/.
Just like other cool books data science with R, this book is also entirely written with R Markdown and all the visualizations are made with ggplot2.


Very excited to announce my latest project, a book on data visualization. Approximately half of the book is written, and all completed chapters are now available as online preview. #rstats #datavizhttps://t.co/PFHFJtkmwO pic.twitter.com/gn1lAGZ21i

— Claus Wilke (@ClausWilke) January 23, 2018

This book does not teach R and assumes you know a bit of R. The main focus of the book data visualization. As the author says

The book is meant as a guide to making visualizations that accurately reflect the data, tell a story, and look professional.

And a quick look at the book tells that this data visualization book is a fantastic resource on all things visualizations. Even with a little glance, you can easily learn how to make your figures better.

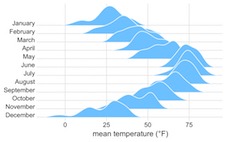
If you are interested data science, Claus Wilke’s earlier R packages are a must. He has made two beautiful R packages Cowplot that enables to combine multiple ggplots in a single plot and ggridges or joyplot. They both are excellent additions to your data science tool kit to do exploratory data analysis (EDA).

Share this:

  • Click to share on Facebook (Opens in new window) Facebook
  • Click to share on X (Opens in new window) X

Related posts:

Data Visualization, A practical introductionBook Review – Data Visualization: A Practical Introduction Default ThumbnailBook Review: Fundamentals of Data Visualization Doing Data Science at the Command LineData Science at the Command Line: Free Online Book R Books/Resources for Data Science21 Free Online Books to Learn R and Data Science

Filed Under: Data Visualization, Free R Books Online, R Tips Tagged With: Book on Data Visualization, Free R Book Online, R Tips

Primary Sidebar

Subscribe to Python and R Tips and Learn Data Science

Learn Pandas in Python and Tidyverse in R

Tags

Altair Basic NumPy Book Review Data Science Data Science Books Data Science Resources Data Science Roundup Data Visualization Dimensionality Reduction Dropbox Dropbox Free Space Dropbox Tips Emacs Emacs Tips ggplot2 Linux Commands Linux Tips Mac Os X Tips Maximum Likelihood Estimation in R MLE in R NumPy Pandas Pandas 101 Pandas Dataframe Pandas Data Frame pandas groupby() Pandas select columns Pandas select_dtypes Python Python 3 Python Boxplot Python Tips R rstats R Tips Seaborn Seaborn Boxplot Seaborn Catplot Shell Scripting Sparse Matrix in Python tidy evaluation tidyverse tidyverse 101 Vim Vim Tips

RSS RSS

  • How to convert row names to a column in Pandas
  • How to resize an image with PyTorch
  • Fashion-MNIST data from PyTorch
  • Pandas case_when() with multiple examples
  • An Introduction to Statistical Learning: with Applications in Python Is Here
  • 10 Tips to customize ggplot2 title text
  • 8 Plot types with Matplotlib in Python
  • PCA on S&P 500 Stock Return Data
  • Linear Regression with Matrix Decomposition Methods
  • Numpy’s random choice() function

Copyright © 2025 · Lifestyle Pro on Genesis Framework · WordPress · Log in

Go to mobile version