Python’s visualization options can be difficult to grasp, if you recently moved to use Python after using R for a while. There are a lot of options. Multiple options for visualizations are good. Especially, mature matplotlib, Seaborn, Bokeh and the new library like Altair are great to learn and use for data visualization in Python.
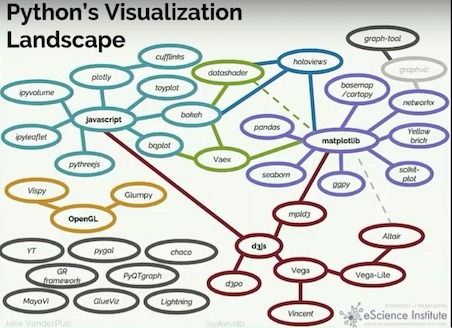
In last year’s PyCon, Jake gave a fantastic talk capturing the landscape of Python Visualization libraries. Yes, it is complex 🙂 The talk is a must watch if you are interested in data visualization in Python.

ggplot2 library is one of the best data visualization libraries. If you are coming from R background and know ggplot2, you might want to still use ggplot2 in Python for making great visualizations. Thanks to plotnine library, you can use ggplot2 right from Python.
Let us load some data to make plots with plotnine.
gapminder_url='https://bit.ly/2cLzoxH'
gapminder = pd.read_csv(gapminder_url)
gapminder.head()
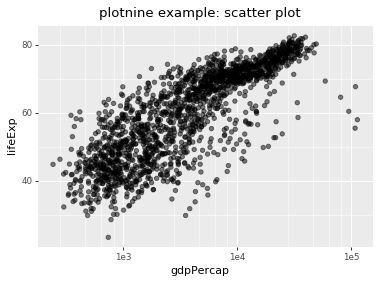
To make a scatterplot with plotnine in Python, we just simply need to type the ggplot2 commands
(ggplot(gapminder)
 + geom_point(aes(x='gdpPercap', y='lifeExp'), alpha=0.5, size=2)
 + ggtitle('plotnine example: scatter plot')
 + scale_x_log10()
)

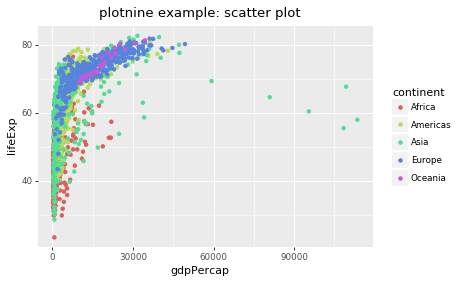
Let us consider another example of making scatter plot and saving to a file. We can save ggplot object as a variable and use ggsave to save the plot into a file.
p = ggplot(gapminder) +
    geom_point(aes(x='gdpPercap', y='lifeExp',color='continent')) +
    ggtitle('plotnine example: scatter plot')
ggsave(plot=p, filename='scatter_plot_with_plotnine.png', dpi=100)