Let us simulate coin toss experiment with Python. Mathematically, coin toss experiment can be thought of a Binomial experiment, where we have a coin with probability of getting head as success at each coin toss is p. In a binomial experiment, given n and p, we toss the coin n times and we are interested in the number of heads/successes we will get.
Load the packages needed
import numpy as np
import pandas as pd
import random
import matplotlib.pyplot as plt
np.random.seed(42)
Tossing a fair coin once
Let us say we have a fair coin and toss the coin just once. We will observe either a head or a tail. We can code 1 for head and 0 for tail.
Let us simulate a single fair coin toss experiment with the binomial distribution function in Python.
>n = 1
>p = 0.5
>np.random.binomial(n,p)
0
In the above experiment, tossing a coin just once we observed a tail since we got zero.
One Experiment: Tossing a fair coin multiple times
We can easily repeat the coin toss experiment multiple times by changing n. If we want to know the nmber of heads we will observe if toss the coin 10 times, we can use n=10
# set the seed to get same random numer
>np.random.seed(42)
>n = 10
>p = 0.5
>np.random.binomial(n, p)
4
Here, when tossing the fair coin 10 times we get 4 heads.
Tossing an unfair coin multiple times
In the above experiment, we used a fair coin. We can easily simulate an unfair coin by changing the probability p. For example, to have coin that is biased to produce more head than tail, we will choose p < 0.5. And if we want to have biased coin to produce more tails than heads, we will choose p > 0.5.
Let us toss a biased coin producing more heads than tails, p=0.7, 10 times,
>np.random.seed(42)
>n = 10
>p = 0.7
>np.random.binomial(n, p)
8
In this case, when we toss our biased (towards head) coin 10 times, we observed 7 heads.
Tossing a totally biased coin
We can also simulate a completely biased coin with p =0 or p=1
When we toss a totally biased (towards head) coin 10 times and we observe 10 heads.
>n = 10
>p = 1
>np.random.binomial(n, p)
10
Repeating the Coin Toss experiment
In the above examples, we tossed a single coin “n=10” times. That is our single experiment. Often to see how reliable our coin toss experiment is we might want to repeat the experiment multiple times( or think of throwing multiple coins). We can easily simulate multiple experiments with the option “size” in numpy.random.binomial function.
Let us repeat our coin toss experiment 100 times, where in each experiment we toss a fair coin 10 times. Let us ask how many heads we see in each of the 100 experiments.
>np.random.seed(42)
>n=10
>p=0.5
# let us repeat our experiment for 100 times
>size=100
>x=np.random.binomial(n=n, p=p, size=size)
x
We get the number of heads in each experiment.
array([4, 8, 6, 5, 3, 3, 3, 7, 5, 6, 2, 8, 7, 4, 4, 4, 4, 5, 5, 4, 5, 3,
       4, 4, 5, 6, 4, 5, 5, 2, 5, 3, 3, 8, 8, 6, 4, 3, 6, 5, 3, 5, 2, 7,
       4, 6, 4, 5, 5, 4, 8, 6, 7, 7, 5, 7, 3, 4, 2, 4, 5, 4, 7, 4, 4, 5,
       3, 6, 3, 8, 6, 4, 1, 6, 6, 6, 6, 3, 4, 3, 7, 6, 4, 3, 4, 4, 6, 6,
       7, 5, 3, 6, 6, 5, 6, 5, 5, 5, 2, 3])
Probability of seeing x heads out of n=10 coin tosses
We started with a simple experiment, tossing a far coin 10 times. And we repeated the experiment 100 times and measured how many successes/heads we observed. We can use the number of successes (heads) observed in many ways to understand the basics of probability. For example, we can simply count how many times we see 0 heads, 1 head, 2 heads with our fair coin toss, and so on.
>[np.equal(x,i).sum() for i in range(n)]
[0, 1, 5, 16, 23, 21, 19, 9, 6, 0]
We can see that, in our 100 experiments we never saw all heads and all tails with our fair coin (as the first and last element are zero). We can also see that we observe more times 4, or 5, or 6 heads. The above success counts sums to 100, our total number of experiments. We can use the observed successes to estimate the probability of getting x successes in n=10 coin tosses by dividing by 100.
>probs_100 = [np.equal(x,i).mean() for i in range(n)]
print(probs_100)
[0.0, 0.01, 0.05, 0.16, 0.23, 0.21, 0.19, 0.09, 0.06, 0.0]
Let us plot the probability of x successes that we just computed.
plt.xticks(range(n))
plt.plot(list(range(n)), probs_100, color='blue', marker='o')
plt.xlabel('Number of Heads',fontsize=14)
plt.ylabel('Probability',fontsize=14)

We can see from the above plot that probability of seeing 4 heads is the highest, closely followed by probability of seeing 5 heads. Note that this observation might vary depending on the realization of our random simulation.
100000 repeated experiments
We know that it is a fair, so we would expect that if we repeat the experiment many more times we should see that probability of seeing 5 heads should be the highest. So, let us repeat our coin toss experiment 100,000 times and compute the probability of seeing n heads like above.
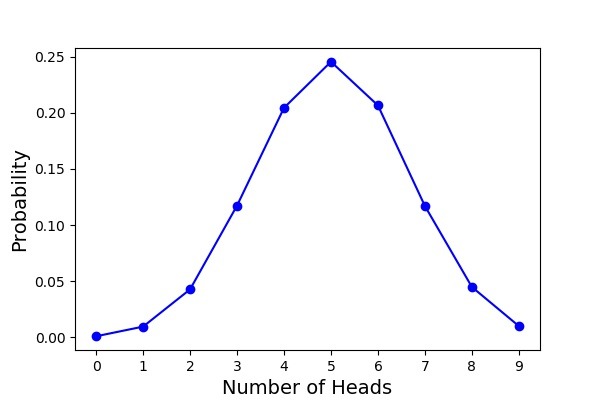
Now we can see that probability of seeing 5 heads is the highest as we expected. What is neat is that even if we don’t know if the coin is fair or not, if we do repeated experiments like above and observed the number of successes, we can infer if the coin is fair or not.
Tossing Biased Coins
Let us do our experiment with biased coins. Let us say we have a coin and we suspect it is a biased coin. Let us what we can infer about how unfair the coin is by repeated experiments like before.
Just as described before, let us toss the unfair coin 10 times, repeat it for 100,000 times, and count the number of successes. Let us use the number of successes to get the probability of x successes and plot it.

We can see from the above plot that the probability of successes is highest when the number of successes/heads is 7. Therefore, we can infer that the biased coin has probability of success p=0.7.


