• Skip to secondary menu
  • Skip to main content
  • Skip to primary sidebar

Python and R Tips

Learn Data Science with Python and R

  • Home
  • Python
  • Pandas
    • Pandas 101
  • tidyverse
    • tidyverse 101
  • R
  • Linux
  • Conferences
  • Python Books
  • About
    • Privacy Policy
You are here: Home / R / Change axis ticks mark labels ggplot2 / How To Change Axis Tick Marks in R?

How To Change Axis Tick Marks in R?

March 22, 2019 by cmdlinetips

One of most common things one might do while making plots is to change tiny details of the plot to make them better. Often, one of such adjustments are changing x-axis tick mark label/text on a plot made with ggplot2 in R.

How to Change X-axis Tick Mark Label?

Let us use ggplot2 to make plot first and then fix its x-axis tick mark labels.

library(ggplot2)
library(tibble)

We will create a toy data frame using tibble with two column variables.

n <- 4
# create a tibble
df <- tibble(gender = c(rep("0",n), rep("1",n)),
             weight = c(rnorm(n,100,sd=5), rnorm(n,150,sd=5)))

A glimpse at the data frame shows that first column is a characeter variable and second is numeric.

>head(df)

gender  weight
&lt;chr&gt; . &lt;dbl&gt;
0	106.85479			
0	97.17651			
0	101.81564			
0	103.16431			
1	152.02134			
1	149.46938			

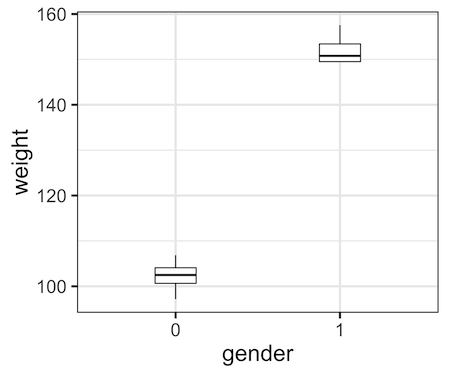
Let us make a boxplot with ggplot2 using the above dataframe.

# make boxplot with ggplot2
df %>% 
  ggplot(aes(x=gender,y=weight))+
  geom_boxplot(width=0.25) 

Note that in the boxplot we made right now, the x-axis variable gender has two levels, coded as 0 and 1. ggplot automatically found these levels and marked the X-axis tick mark labels as 0 and 1. You might know that the codes 0 & 1 correspond to Female and Male. And the plot is much easier read with Female and Male on the x-axis tick mark instead of 0 and 1.

Boxplot before fixing x-axis ticks mark

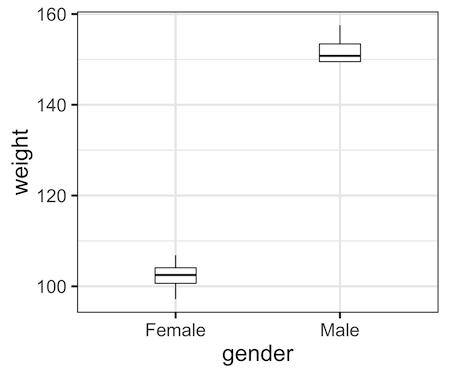
To change the x-axis tick mark label, from 0 & 1 to Female and Male here, we can add a layer scale_x_discrete() and specify the breaks currently used and specify the labels that we actually want, as shown below.

df %>% 
  ggplot(aes(x=gender,y=weight)) +
  geom_boxplot(width=0.25) +
  scale_x_discrete(breaks=c("0", "1"),
                      labels=c("Female", "Male"))

Voila, now the x-axis tick label text is Female and Male as we wanted.

Boxplot after fixing x-axis ticks_label

If you want to change y-axis tick mark labels, you can use scale_y_discrete().

Share this:

  • Click to share on Facebook (Opens in new window) Facebook
  • Click to share on X (Opens in new window) X

Related posts:

Default ThumbnailHow to Recode a Column with dplyr in R? reorder boxplot RHow To Reorder a Boxplot in R? Hint: Use forcats Boxplot with jittered Data Points in RHow to Make Boxplot in R with ggplot2? ggplot2 change legend title with guides()How To Change Legend Title in ggplot2?

Filed Under: Change axis ticks mark labels ggplot2, ggplot2, R Tips Tagged With: Change axis ticks mark labels ggplot2, Change x-axis tick mark, ggplot2, R

Primary Sidebar

Subscribe to Python and R Tips and Learn Data Science

Learn Pandas in Python and Tidyverse in R

Tags

Altair Basic NumPy Book Review Data Science Data Science Books Data Science Resources Data Science Roundup Data Visualization Dimensionality Reduction Dropbox Dropbox Free Space Dropbox Tips Emacs Emacs Tips ggplot2 Linux Commands Linux Tips Mac Os X Tips Maximum Likelihood Estimation in R MLE in R NumPy Pandas Pandas 101 Pandas Dataframe Pandas Data Frame pandas groupby() Pandas select columns Pandas select_dtypes Python Python 3 Python Boxplot Python Tips R rstats R Tips Seaborn Seaborn Boxplot Seaborn Catplot Shell Scripting Sparse Matrix in Python tidy evaluation tidyverse tidyverse 101 Vim Vim Tips

RSS RSS

  • How to convert row names to a column in Pandas
  • How to resize an image with PyTorch
  • Fashion-MNIST data from PyTorch
  • Pandas case_when() with multiple examples
  • An Introduction to Statistical Learning: with Applications in Python Is Here
  • 10 Tips to customize ggplot2 title text
  • 8 Plot types with Matplotlib in Python
  • PCA on S&P 500 Stock Return Data
  • Linear Regression with Matrix Decomposition Methods
  • Numpy’s random choice() function

Copyright © 2025 · Lifestyle Pro on Genesis Framework · WordPress · Log in

Go to mobile version