
Boxplots are one of the most common ways to visualize data distributions from multiple groups. In Python, Seaborn potting library makes it easy to make boxplots and similar plots swarmplot and stripplot. Sometimes, your data might have multiple subgroups and you might want to visualize such data using grouped boxplots.
Here, we will see examples of How to make grouped boxplots in Python. We will use Seaborn to make the grouped boxplots. In addition to grouped boxplots, we will also see examples of related visualizations in Python, grouped stripplots (which are simply plotting the original data points with jitter and grouped swarmplot. If you are interested in making simple boxplots in Python, see this How to Make Boxplots in Python?
Let us first load the python modules needed for making the grouped boxplots.
# import pandas
import pandas as pd
# import matplotlib
import matplotlib.pyplot as plt
# import seaborn
import seaborn as sns
%matplotlib inline
We will use gapminder dataset to make grouped boxplots. Software Carpentry github page has the data and we will directly download it using Pandas’ read_csv function.
data_url = 'http://bit.ly/2cLzoxH'
# read data from url as pandas dataframe
gapminder = pd.read_csv(data_url)
print(gapminder.head(3))
For our examples, let us filter the gapminder data such that we will keep gapminder data corresponding to just two years; 1952 and 2007. We will use pandas’ isin function to select rows whose year value equals to the two years and subset the original dataframe.
# subset the gapminder data frame for rows with year values 1952 and 2007
df1 = gapminder[gapminder['year'].isin([1952,2007])]
# get a look at the data with head function
df1.head(n=3)

country	year	pop	continent	lifeExp	gdpPercap
0	Afghanistan	1952	8425333.0	Asia	28.801	779.445314
11	Afghanistan	2007	31889923.0	Asia	43.828	974.580338
12	Albania	1952	1282697.0	Europe	55.230	1601.056136
How To Make Grouped Boxplot in Python?
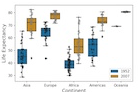
Seaborn’s boxplot function can make both simple boxplots and grouped boxplots. We use grouped boxplot to visualize life expectancy values for two years across multiple continents.
Let us make a grouped boxplot with continent on x-axis and lifeExp on the y-axis such that we see distributions of lifeExp for two years separately for each continent.
To specify which variable we would like to group, we use the argument hue in boxplot function. Here, hue=’year’ as we want to grouped boxplot for two years.
sns.boxplot(y='lifeExp', x='continent',
                 data=df1,
                 palette="colorblind",
                 hue='year')

How To Make Grouped stripplot in Python?
An alternative to boxplot in Python is simply plotting the original data points with jitter using Seaborn’s stripplot. One of the biggest benefits of stripplot is we can actually see the original data and its distributions, instead of just the summary.
Let us plot the same variables using Seaborn’s stripplot function. We specify jitter=True to add random noise to lifeExp values. And to make a grouped stripplot, we specify hue=’year’.
bplot=sns.stripplot(y='lifeExp', x='continent',
                   data=df1,
                   jitter=True,
                   marker='o',
                   alpha=0.5,
                   hue='year')
We get a nice visualization of the distribution of the data. The hue argument nicely colors the data point based on which year it is. We can clearly see that lifeExp for the year=2002 is higher than 1952 for all continents.
However, unlike boxplot, stripplot by default does not separate the data points for year.

In order to split the data points in stripplot for each year within a continent, we need to specify the argument dodge=True.
sns.stripplot(y='lifeExp', x='continent',
                   data=df1,
                   jitter=True,
                   dodge=True,
                   marker='o',
                   alpha=0.5,
                   hue='year')
The dodge=True argument splits the data nicely like you see in grouped boxplot and each year in different color.

How to Make Grouped Boxplot with Original Data Points in Python?
Both the boxplot and stripplot have their own charm. Often, having boxplot with the original data makes sense and help us understand more about the data.
Luckily, it is pretty straightforward to combine boxplot with the stripplot in Python. First, we make the boxplot and then add the stripplot on it as follows.
# make grouped boxplot
sns.boxplot(y='lifeExp', x='continent',
                 data=df1,
                 palette="colorblind",
                  hue='year')
# make grouped stripplot
sns.stripplot(y='lifeExp', x='continent',
                   data=df1,
                   jitter=True,
                   dodge=True,
                   marker='o',
                   alpha=0.5,
                   hue='year',
                   color='grey')
Voila, we have a beautiful grouped boxplot and with the original data plotted over the boxplot using stripplot.

One caveat though, now we have two sets of legend, one from box plot and the other from stripplot. The hack to correct that is first assign the plot objects to some variable, then extract the legends using the matplotlib function get_legend_handles_labels() from that variable and specify just one set of legends.
# make grouped boxplot and save it in a variable
bp = sns.boxplot(y='lifeExp', x='continent',
                 data=df1,
                 palette="colorblind",
                  hue='year')

# make grouped stripplot and save it in a variable
bp = sns.stripplot(y='lifeExp', x='continent',
                   data=df1,
                   jitter=True,
                   dodge=True,
                   marker='o',
                   alpha=0.5,
                   hue='year',
                   color='grey')
# get legend information from the plot object
handles, labels = bp.get_legend_handles_labels()
# specify just one legend
l = plt.legend(handles[0:2], labels[0:2])


