Just recently stumbled on to Seaborn’s ClusterMap function for making heatmaps. Till now relied on Seaborn’s heatmap function for making simple heatmaps with Seaborn heatmap() function and using pheatmap package in R for anything bit complex. Seaborn’s Clustermap function is great for making simple heatmaps and hierarchically-clustered heatmaps with dendrograms on both rows and/or columns.… Continue reading Heatmaps with Seaborn’s ClusterMap
Tag: Python Tips
Image Reconstruction using Singular Value Decomposition (SVD) in Python
In this post, we will explore the use of SVD on Image analysis. We will mainly use SVD on images to get main components/singular vectors capturing the image and use part of them to reconstruct the image. Singular Value Decomposition (SVD) is one of the commonly used dimensionality reduction techniques. SVD/PCA is the mainstay of… Continue reading Image Reconstruction using Singular Value Decomposition (SVD) in Python
How to Add Group-Level Summary Statistic as a New Column in Pandas?
In this post, we will see an example adding results from one of aggregating functions like mean/median after group_by() on a specific column as a new column. In other words, we might have group-level summary values for a column and we might to add the summary values back to the original dataframe we computed group-level… Continue reading How to Add Group-Level Summary Statistic as a New Column in Pandas?
How to Create Ordered Dictionary in Python?
Dictionary in Python is one of the most useful core data structures in Python. Sometimes, you may want to create a dictionary and also maintain the order of items you inserted when you are iterating the keys. Python’s collections module has OrderedDict that lets you create a ordered dictionary. Let us see an example of… Continue reading How to Create Ordered Dictionary in Python?
How To Make Grouped Boxplots in Python with Seaborn?

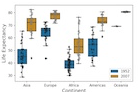
Boxplots are one of the most common ways to visualize data distributions from multiple groups. In Python, Seaborn potting library makes it easy to make boxplots and similar plots swarmplot and stripplot. Sometimes, your data might have multiple subgroups and you might want to visualize such data using grouped boxplots. Here, we will see examples… Continue reading How To Make Grouped Boxplots in Python with Seaborn?