Let us use gapminder data to make a scatter plot and save the ggplot object. We will use the ggplot object in our examples with the themes for ggplot.
head(gapminder)
p_obj <- gapminder %>%
  sample_n(200) %>%
  ggplot(aes(x=lifeExp, y=gdpPercap)) +
  geom_point(alpha=0.5)+
  scale_y_log10()
p_obj
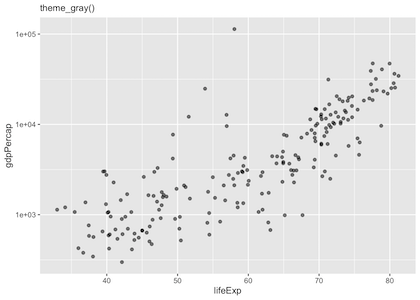
1. theme_gray()
The default theme of ggplot is grey. We can also specify grey theme with grey_theme() and add it as a layer.
grey <- p_obj +theme_gray() +labs(subtitle = "theme_gray()")
grey
2. theme_bw()
bw <- p_obj +theme_bw()+labs(subtitle = "theme_bw()")
bw

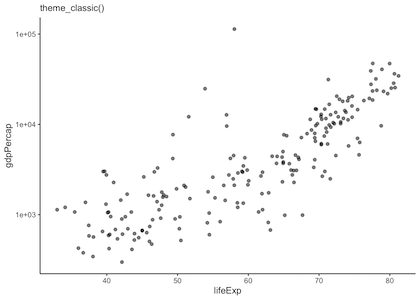
3. theme_classic()
classic <- p_obj + theme_classic() +labs(subtitle = "theme_classic()")
classic
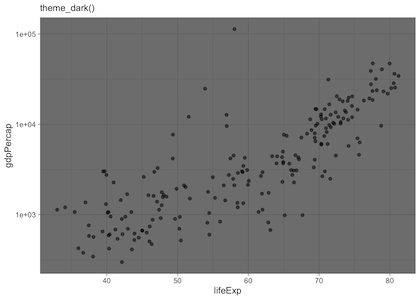
4. theme_dark()
dark <- p_obj + theme_dark() +labs(subtitle = "theme_dark()")
dark
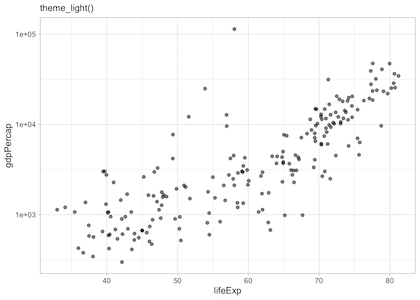
5. theme_light()
light <- p_obj + theme_light() + labs(subtitle = "theme_light()")
light
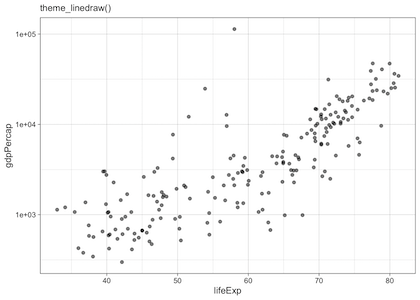
6. theme_linedraw()
linedraw <- p_obj + theme_linedraw() +labs(subtitle = "theme_linedraw()")
linedraw
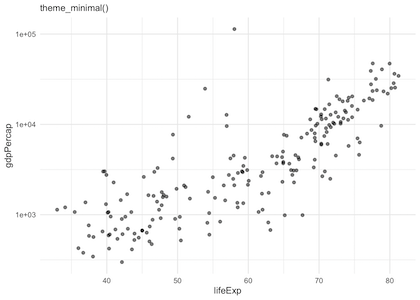
7. theme_minimal()
minimal <- p_obj + theme_minimal() +labs(subtitle = "theme_minimal()")
minimal
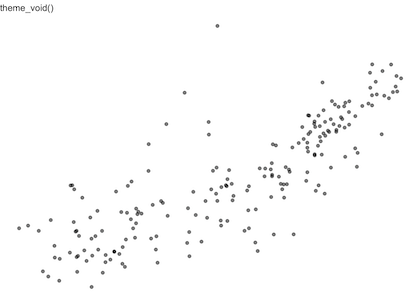
8. theme_void()
void <- p_obj + theme_void()+labs(subtitle = "theme_void()")
void
library(gridExtra)
grid.arrange( grey, bw, light, dark, classic,linedraw, minimal, void, ncol=2)


