
The second edition of Data Science from Scratch, First Principles with Python from Joel Grus is here (since the summer of 2019). The first edition of the book came about 4-5 years ago when data science as a field was nascent and majority of Python was in 2.7.
There are two aspects to learn data science. First is, one has to be good at using data science toolkits to solve problems quickly. Once one has gotten the grasp of that, one also need to go beyond using the toolset as a blackbox. At least for some of the tools and techniques, one may need to take deep dive into some of the techniques and learn the nuts and bolts of it and the fundamentals behind them.
This is where Data Science from Scratch stands out among the available Data Science books. The second edition of it shows how one can understand and implement some of the common (and very useful) data science techniques from scratch using Python 3.6.
Who is this book for?
Data Science from scratch is a great book for anyone who likes Data Science and has an interest in a bit of mathematics/statistics and programming skills. The book teaches basic linear algebra, probability, and statistics needed to understand the common data science techniques.
If you want more details, the author Joel Grus show how to implement common machine learning models like k-nearest neighbors, Naïve Bayes, linear and logistic regression, decision trees, dimensionality reduction and neural networks from SCRATCH. yes scratch in capitals not using the Python libraries like scikit-learn and Pandas. Implementing your favorite machine learning technique from scratch will give the level of understanding you have not had before.
If you have the first edition of the book, the new edition is still worthwhile. First it is all in Python 3, which is great and in addition it has new materials deep learning, statistics, and natural language processing.
I got hold of this book just about a little over two months ago. Finally had a chance to go over some of the chapters. The book has over 27 chapters from a crash course in Python 3 to Data Ethics. So, I have not really gone through all of the chapters. The few chapters I went through is enough to give my early impression on the book.
What I like about this book
Most basic and an important thing I learned from this book is about Python 3.0. I have used Python 2 a lot and relatively new to Python 3. I have picked up the new features of Python 3 on need basis. One of the things that I missed picking up in Python 3.0 is writing Python functions with type hints.
Type Annotations in Python 3
When we normally write python functions, we do not worry about type of the variables used in the function because Python is dynamically typed language. I am pretty sure, if you have written code long enough, you would have wondered (and confused) about types of a variables more than once (even if it your own code ).
In Python 3, starting from version 3.5 one can annotate variables with their types. For example, if we are writing a function, previously we would write
def greeting(name):
    return 'Hello ' + name
Now with type hinting we would annotate the variables with their types and write as
def greeting(name: str) -> str:
    return 'Hello ' + name
Here, the argument name is of type str and the return type str. Although it is a bit confusing at first, one can immediately see the usefulness of it.
The book gives a great introduction to type hinting in the chapter on Crash course on Python and goes on to use it consistently across all of the code snippets in the book.
Note that
The Python runtime does not enforce function and variable type annotations. They can be used by third party tools such as type checkers, IDEs, linters, etc.
Implementing Beta Distributions from scratch
The set of chapters that are a must are on the basics of probability, statistics and hypothesis testing. Here is my favorite sample from these chapters.
Understanding probability distributions can come in handy in a number of situations in doing data science. SciPy has fantastic functions to generate random numbers from different probability distributions. One of my favorite probability distribution is Beta Distribution. It is kind of a special distribution as it represents a distribution of probabilities. Check out David Robinson’s fantastic series of posts on it and its use in base ball. Beta Distribution is commonly used as prior in Bayesian computing because of its special properties. And a class example Beta distribution as a prior is A/B testing, the poster child of statistics in Data Science.
Data Science From Scratch has an example showing how to implement functions computing probability density function of beta distribution using Python. It also serves as a simple example of using type annotation while writing functions in Python 3. Here is a quick sample of doing things from scratch.
Let us load the necessary modules.
import numpy as np
import math
import matplotlib.pyplot as plt
%matplotlib inline
The probability density of the beta distribution can be written as


We can implement the above two equations to compute beta distribution from scratch in Python. Joel Grus has done exactly the same in the book. Let us use the Python 3 functions for Beta Distribution pdf with type annotations from the book and tryto understand how beta distribution looks like for different parameters.
The first function computes the normalizing factor in PDF of Beta distribution.
def B(alpha: float, beta: float) -> float:
    """ A normalizing constant to make the total probability is 1 """
    return math.gamma(alpha) * math.gamma(beta)/math.gamma(alpha+beta)
And the second function computes the probability density function for beta distribution.
def beta_pdf(x: float, alpha: float, beta: float) -> float:
    if x <= 0 or x >= 1:
        return 0
    return x ** (alpha -1) * (1 - x) ** (beta-1)/ (B(alpha, beta))
We can use these functions to compute the pdf for different parameter values of beta distribution, alpha and beta.
When alpha and beta equals 1
alpha = 1
beta = 1
x = np.linspace(0, 1.0, num=20)
beta_1_1 = [beta_pdf(i,alpha,beta) for i in x ]
When alpha and beta equals 10
alpha=10
beta=10
beta_10_10 = [beta_pdf(i,alpha,beta) for i in x ]
When alpha = 4 and beta = 16
alpha=4
beta=16
beta_4_16 = [beta_pdf(i,alpha,beta) for i in x ]
When alpha = 16 and beta = 4
alpha=16
beta=4
beta_16_4 = [beta_pdf(i,alpha,beta) for i in x ]
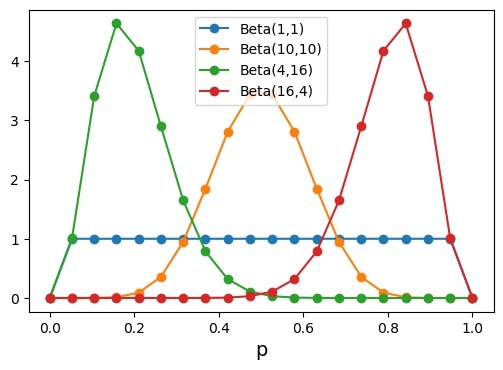
Now that we have pdf values for different beta distributions we can visualize them by plotting.
fig,ax=plt.subplots()
ax.plot(x, beta_1_1, marker="o", label="Beta(1,1)")
ax.plot(x, beta_10_10, marker="o", label="Beta(10,10)")
ax.plot(x, beta_4_16, marker="o", label="Beta(4,16)")
ax.plot(x, beta_16_4, marker="o", label="Beta(16,4)")
ax.legend(loc='upper center')
ax.set_xlabel("p",fontsize=14)
#ax.set_ylabel("lifeExp/gdpPercap",fontsize=14)
plt.show()
fig.savefig('beta_distribution_example_data_science_from_scratch.jpg',
            format='jpeg',
            dpi=100,
            bbox_inches='tight')
Must read: The chapter on Gradient Descent
If you have time for actually implementing a core algorithm useful for data science, I would strongly suggest to do it with the chapter 8 on Gradient Descent. If you are not familiar with it, gradient descent is an iterative algorithm for finding the maximum or minimum of a function.
A lot of data science/machine learning algorithms try to optimize some function, which is essentially the same problem that gradient descent algorithm offers solution to. Learning to implement gradient descent algorithm help grasp the fundamentals much better. Look out for a post on implementing and using gradient descent algorithm from scratch soon.
These are quick thoughts on the Data Science from Scratch and look forward to delve into some other examples soon here.
Final two cents is The second edition of Data Science from Scratch is a fantastic must have book for anyone interested in Data Science. It stands out from other data science books by design – by implementing core data science and machine learning algorithms from scratch and offers an easy way to understand these algorithms fast and deep. And on Amazon it is available at half of its original price, another reason to have the book.


