• Skip to secondary menu
  • Skip to main content
  • Skip to primary sidebar

Python and R Tips

Learn Data Science with Python and R

  • Home
  • Python
  • Pandas
    • Pandas 101
  • tidyverse
    • tidyverse 101
  • R
  • Linux
  • Conferences
  • Python Books
  • About
    • Privacy Policy
You are here: Home / Archives for Machine Learning

Machine Learning

Linear Regression Using Matrix Multiplication in Python Using NumPy

March 17, 2020 by cmdlinetips

Linear Regression fit with Matrix Multiplication in Python

Linear Regression is one of the commonly used statistical techniques used for understanding linear relationship between two or more variables. It is such a common technique, there are a number of ways one can perform linear regression analysis in Python. In this post we will do linear regression analysis, kind of from scratch, using matrix […]

Filed Under: Linear Regression by Matrix Multiplication, Linear Regression in Python, Python Tips, Scikitlearn Linear Regression Tagged With: Linear Regression, Linear Regression by Matrix Multiplication

Introduction to Probabilistic Programming with PyStan

December 14, 2019 by cmdlinetips

Stan, developed by a team led by Andrew Gelman, is one of the leading languages to do probabilistic computing. The core of probabilistic computing lies in Bayesian statistics. Stan gets its name in honor of Stanislaw Ulam, co-inventor of the Monte Carlo method, the computational engine behind all Bayesian computing. Stan is C++ package providing […]

Filed Under: Introduction to PyStan, PyStan, PyStan Example Tagged With: PyStan

Introduction to Linear Regression in R

November 2, 2019 by cmdlinetips

linear regression: scatter plot

Linear Regression is one of the most commonly used statistical methods. Linear modeling and Linear regression helps us understand the relationship between multiple variables. In the simplest case, linear regression is about understanding the relation between two variables, X and Y. One of the ways to understand linear regression is that we have the observed […]

Filed Under: Linear Regression in R Tagged With: Linear Regression in R

Introduction to Linear Regression in Python

September 23, 2019 by cmdlinetips

Linear Regression example: Scatterplot

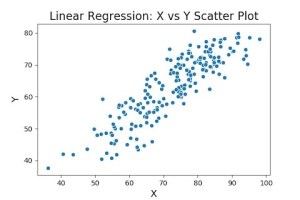
Linear regression is one of the most commonly used statistical technique to understand relationship between two quantitative variables (in the simplest case). Simple linear regression models relationship between two variables X and Y, where X and Y are vectors with multiple values. For example, X could how well each country is doing economically, like GDP […]

Filed Under: Linear Regression in Python, Scikitlearn Linear Regression Tagged With: Linear Regression in Python, Scikitlearn Linear Regression

Dimensionality Reduction with tSNE in Python

July 14, 2019 by cmdlinetips

tSNE plot: Visualizing high dimensional data

tSNE, short for t-Distributed Stochastic Neighbor Embedding is a dimensionality reduction technique that can be very useful for visualizing high-dimensional datasets. tSNE was developed by Laurens van der Maaten and Geoffrey Hinton. Unlike, PCA, one of the commonly used dimensionality reduction techniques, tSNE is non-linear and probabilistic technique. What this means tSNE can capture non-linaer […]

Filed Under: Dimensionality Reduction with tSNE, tSNE in Python Tagged With: Dimensionality Reduction with tSNE, tSNE in Python

  • « Go to Previous Page
  • Page 1
  • Page 2
  • Page 3
  • Go to Next Page »

Primary Sidebar

Subscribe to Python and R Tips and Learn Data Science

Learn Pandas in Python and Tidyverse in R

Tags

Altair Basic NumPy Book Review Data Science Data Science Books Data Science Resources Data Science Roundup Data Visualization Dimensionality Reduction Dropbox Dropbox Free Space Dropbox Tips Emacs Emacs Tips ggplot2 Linux Commands Linux Tips Mac Os X Tips Maximum Likelihood Estimation in R MLE in R NumPy Pandas Pandas 101 Pandas Dataframe Pandas Data Frame pandas groupby() Pandas select columns Pandas select_dtypes Python Python 3 Python Boxplot Python Tips R rstats R Tips Seaborn Seaborn Boxplot Seaborn Catplot Shell Scripting Sparse Matrix in Python tidy evaluation tidyverse tidyverse 101 Vim Vim Tips

RSS RSS

  • How to convert row names to a column in Pandas
  • How to resize an image with PyTorch
  • Fashion-MNIST data from PyTorch
  • Pandas case_when() with multiple examples
  • An Introduction to Statistical Learning: with Applications in Python Is Here
  • 10 Tips to customize ggplot2 title text
  • 8 Plot types with Matplotlib in Python
  • PCA on S&P 500 Stock Return Data
  • Linear Regression with Matrix Decomposition Methods
  • Numpy’s random choice() function

Copyright © 2025 · Lifestyle Pro on Genesis Framework · WordPress · Log in

Go to mobile version