• Skip to secondary menu
  • Skip to main content
  • Skip to primary sidebar

Python and R Tips

Learn Data Science with Python and R

  • Home
  • Python
  • Pandas
    • Pandas 101
  • tidyverse
    • tidyverse 101
  • R
  • Linux
  • Conferences
  • Python Books
  • About
    • Privacy Policy
You are here: Home / Archives for Python / Matplotlib

Matplotlib

How to Highlight Data Points with Colors and Text in Python

November 5, 2019 by cmdlinetips

How To Highlight Data Annotate with Text Python?

Sometimes you might want to highlight a select data points on a scatter plot. Often when plotting scatter plots you might want to highlight data points in a different color from the rest of the data points. Other times you want to show select data points in different color and annotate them with text. In […]

Filed Under: Annotate matplotlib, Highlight Data Points in Color Python, Python, Python Tips Tagged With: Highlight select points in Python

How to Make a Plot with Two Different Y-axis in Python with Matplotlib ?

October 25, 2019 by cmdlinetips

Plot with two different y-axis with twinx in Python

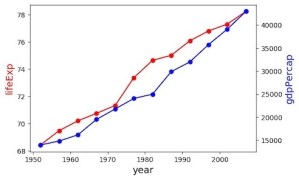
Sometimes, as part of a quick exploratory data analysis, you may want to make a single plot containing two variables with different scales. One of the options is to make a single plot with two different y-axis, such that the y-axis on the left is for one variable and the y-axis on the right is […]

Filed Under: twinx matplotlib, two different y-axis matplotlib Tagged With: matplotlib twinx, python two y-axis

Python’s Matplotlib Version 2.2 is here

March 8, 2018 by cmdlinetips

Colorblind friendly colormap Cividis

Matplotlib, the python’s core plotting library, Matplotlib Version 2.2 is available now. The new Matplotlib Version 2.2 has a lot of new things to try including A new method to automatically decide spacing between subplots. In the current version, one typically uses tight_layout method to tighten the spaces around plot objects The new method called […]

Filed Under: Cividis Colormap, Colorblind friendly plots, Matplotlib, Matplotlib Version 2.2, Python Tips Tagged With: Cividis colormap, colorblind friendly colormap, Matplotlib version 2.2.

Primary Sidebar

Subscribe to Python and R Tips and Learn Data Science

Learn Pandas in Python and Tidyverse in R

Tags

Altair Basic NumPy Book Review Data Science Data Science Books Data Science Resources Data Science Roundup Data Visualization Dimensionality Reduction Dropbox Dropbox Free Space Dropbox Tips Emacs Emacs Tips ggplot2 Linux Commands Linux Tips Mac Os X Tips Maximum Likelihood Estimation in R MLE in R NumPy Pandas Pandas 101 Pandas Dataframe Pandas Data Frame pandas groupby() Pandas select columns Pandas select_dtypes Python Python 3 Python Boxplot Python Tips R rstats R Tips Seaborn Seaborn Boxplot Seaborn Catplot Shell Scripting Sparse Matrix in Python tidy evaluation tidyverse tidyverse 101 Vim Vim Tips

RSS RSS

  • How to convert row names to a column in Pandas
  • How to resize an image with PyTorch
  • Fashion-MNIST data from PyTorch
  • Pandas case_when() with multiple examples
  • An Introduction to Statistical Learning: with Applications in Python Is Here
  • 10 Tips to customize ggplot2 title text
  • 8 Plot types with Matplotlib in Python
  • PCA on S&P 500 Stock Return Data
  • Linear Regression with Matrix Decomposition Methods
  • Numpy’s random choice() function

Copyright © 2025 · Lifestyle Pro on Genesis Framework · WordPress · Log in

Go to mobile version