• Skip to secondary menu
  • Skip to main content
  • Skip to primary sidebar

Python and R Tips

Learn Data Science with Python and R

  • Home
  • Python
  • Pandas
    • Pandas 101
  • tidyverse
    • tidyverse 101
  • R
  • Linux
  • About
    • Privacy Policy
You are here: Home / Archives for Python

Python

How to Make a Plot with Two Different Y-axis in Python with Matplotlib ?

October 25, 2019 by cmdlinetips

Plot with two different y-axis with twinx in Python

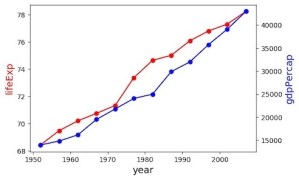
Sometimes, as part of a quick exploratory data analysis, you may want to make a single plot containing two variables with different scales. One of the options is to make a single plot with two different y-axis, such that the y-axis on the left is for one variable and the y-axis on the right is […]

Filed Under: twinx matplotlib, two different y-axis matplotlib Tagged With: matplotlib twinx, python two y-axis

How to Add Group-Level Summary Statistic as a New Column in Pandas?

October 8, 2019 by cmdlinetips

In this post, we will see an example adding results from one of aggregating functions like mean/median after group_by() on a specific column as a new column. In other words, we might have group-level summary values for a column and we might to add the summary values back to the original dataframe we computed group-level […]

Filed Under: Group-level Mean as New Column Tagged With: Python Tips

How to Drop Rows Based on a Column Value in Pandas Dataframe?

October 5, 2019 by cmdlinetips

Pandas Drop Row Conditions on Columns

In this post we will see examples of how to drop rows of a dataframe based on values of one or more columns in Pandas. Pandas drop function makes it really easy to drop rows of a dataframe using index number or index names. We can use Pandas drop function to drop rows and columns […]

Filed Under: Pandas Drop Rows Tagged With: Drop Rows Pandas

Pandas groupby: 13 Functions To Aggregate

October 2, 2019 by cmdlinetips

Fun with Pandas Groupby, Agg,

Pandas groupby function enables us to do “Split-Apply-Combine” data analysis paradigm easily. Basically, with Pandas groupby, we can split Pandas data frame into smaller groups using one or more variables. Pandas has a number of aggregating functions that reduce the dimension of the grouped object. In this post will examples of using 13 aggregating function […]

Filed Under: Pandas 101, Pandas Groupby, Pandas Groupby Aggregating Functions, Python Tips Tagged With: Pandas aggregating functions, Pandas Groupby Aggregating Functions, pandas groupby()

How To Drop Duplicate Rows in Pandas?

September 27, 2019 by cmdlinetips

Pandas drop_duplicates(): remove duplicated data from a dataframe

In this post, we will learn how to drop duplicate rows in a Pandas dataframe. We will use Pandas drop_duplicates() function to can delete duplicated rows with multiple examples. One of the common data cleaning tasks is to make a decision on how to deal with duplicate rows in a data frame. If the whole […]

Filed Under: Drop Duplicate Rows in Pandas, Pandas 101, Python Tips Tagged With: Drop Duplicate Rows in Pandas, pandas duplicated()

  • « Go to Previous Page
  • Page 1
  • Interim pages omitted …
  • Page 13
  • Page 14
  • Page 15
  • Page 16
  • Page 17
  • Interim pages omitted …
  • Page 35
  • Go to Next Page »

Primary Sidebar

Subscribe to Python and R Tips and Learn Data Science

Learn Pandas in Python and Tidyverse in R

Tags

Altair Basic NumPy Book Review Data Science Data Science Books Data Science Resources Data Science Roundup Data Visualization Dimensionality Reduction Dropbox Dropbox Free Space Dropbox Tips Emacs Emacs Tips ggplot2 Linux Commands Linux Tips Mac Os X Tips Maximum Likelihood Estimation in R MLE in R NumPy Pandas Pandas 101 Pandas Dataframe Pandas Data Frame pandas groupby() Pandas select columns Pandas select_dtypes Python Python 3 Python Boxplot Python Tips R rstats R Tips Seaborn Seaborn Boxplot Seaborn Catplot Shell Scripting Sparse Matrix in Python tidy evaluation tidyverse tidyverse 101 Vim Vim Tips

RSS RSS

  • How to convert row names to a column in Pandas
  • How to resize an image with PyTorch
  • Fashion-MNIST data from PyTorch
  • Pandas case_when() with multiple examples
  • An Introduction to Statistical Learning: with Applications in Python Is Here
  • 10 Tips to customize ggplot2 title text
  • 8 Plot types with Matplotlib in Python
  • PCA on S&P 500 Stock Return Data
  • Linear Regression with Matrix Decomposition Methods
  • Numpy’s random choice() function

Copyright © 2026 · Lifestyle Pro on Genesis Framework · WordPress · Log in

Go to mobile version