• Skip to secondary menu
  • Skip to main content
  • Skip to primary sidebar

Python and R Tips

Learn Data Science with Python and R

  • Home
  • Python
  • Pandas
    • Pandas 101
  • tidyverse
    • tidyverse 101
  • R
  • Linux
  • About
    • Privacy Policy
You are here: Home / Archives for Python / Python Tips

Python Tips

How to Get Top N Rows with in Each Group in Pandas?

March 29, 2019 by cmdlinetips

In this post we will see how to get top N rows from a data frame such that the top values of a specific variable in each group defined by another variable. Note this is not the same as top N rows according to one variable in the whole dataframe. Let us say we have […]

Filed Under: Python Tips Tagged With: pandas groupby(), Pandas top N rows in each group, Pandas top rows

How To Select One or More Columns in Pandas?

March 24, 2019 by cmdlinetips

How To Select Columns in Python Pandas?

Selecting a column or multiple columns from a Pandas dataframe is a common task in exploratory data analysis in doing data science/munging/wrangling. In this post, we will see examples of How to select one column from Pandas dataframe? How to select multiple columns from Pandas dataframe? Let us first load Pandas library Let us use […]

Filed Under: Pandas Select a Column, Pandas Select Multiple Columns, Python, Python Tips, Select Columns Pandas Tagged With: Pandas Select a Column, Pandas Select Multiple Columns, Select Columns Pandas

Catplot Python Seaborn: One Function to Rule All Plots With Categorical Variables

March 9, 2019 by cmdlinetips

Catplot: Boxplot with jitter Seaborn

I just discovered catplot in Seaborn. Catplot is a relatively new addition to Seaborn that simplifies plotting that involves categorical variables. In Seaborn version v0.9.0 that came out in July 2018, changed the older factor plot to catplot to make it more consistent with terminology in pandas and in seaborn. The new catplot function provides […]

Filed Under: Python Tips, Seaborn Catplot, Stripplot Python Tagged With: boxen plot Python, Boxplot Python, pointplot Python, Seaborn Catplot, Stripplot Python

How To Make Grouped Boxplots in Python with Seaborn?

March 1, 2019 by cmdlinetips

Grouped boxplot seaborn

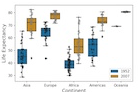
Boxplots are one of the most common ways to visualize data distributions from multiple groups. In Python, Seaborn potting library makes it easy to make boxplots and similar plots swarmplot and stripplot. Sometimes, your data might have multiple subgroups and you might want to visualize such data using grouped boxplots. Here, we will see examples […]

Filed Under: Grouped Boxplot in Python, Grouped boxplot with data points in Python, Python Boxplot, Python Tips Tagged With: Grouped Boxplot in Python, Grouped Boxplot Seaborn, Python Boxplot, Python Tips

How To Merge/Join DataFrames with Pandas in Python?

December 22, 2018 by cmdlinetips

Inner Join with Pandas Merge

One of the most common data science tasks – data munge/data cleaning, is to combine data from multiple sources. When you have the data in tabular forms, Python Pandas offers great functions to merge/join data from multiple data frames. Here we will see example scenarios of common merging operations with simple toy data frames. Let […]

Filed Under: Merge Dataframes, Pandas DataFrame, Pandas Merge, Pandas Tutorial, Python Tips Tagged With: Pandas Merge, Pandas Merge Dataframe, Python Merge Dataframes

  • « Go to Previous Page
  • Page 1
  • Interim pages omitted …
  • Page 9
  • Page 10
  • Page 11
  • Page 12
  • Page 13
  • Interim pages omitted …
  • Page 20
  • Go to Next Page »

Primary Sidebar

Subscribe to Python and R Tips and Learn Data Science

Learn Pandas in Python and Tidyverse in R

Tags

Altair Basic NumPy Book Review Data Science Data Science Books Data Science Resources Data Science Roundup Data Visualization Dimensionality Reduction Dropbox Dropbox Free Space Dropbox Tips Emacs Emacs Tips ggplot2 Linux Commands Linux Tips Mac Os X Tips Maximum Likelihood Estimation in R MLE in R NumPy Pandas Pandas 101 Pandas Dataframe Pandas Data Frame pandas groupby() Pandas select columns Pandas select_dtypes Python Python 3 Python Boxplot Python Tips R rstats R Tips Seaborn Seaborn Boxplot Seaborn Catplot Shell Scripting Sparse Matrix in Python tidy evaluation tidyverse tidyverse 101 Vim Vim Tips

RSS RSS

  • How to convert row names to a column in Pandas
  • How to resize an image with PyTorch
  • Fashion-MNIST data from PyTorch
  • Pandas case_when() with multiple examples
  • An Introduction to Statistical Learning: with Applications in Python Is Here
  • 10 Tips to customize ggplot2 title text
  • 8 Plot types with Matplotlib in Python
  • PCA on S&P 500 Stock Return Data
  • Linear Regression with Matrix Decomposition Methods
  • Numpy’s random choice() function

Copyright © 2026 · Lifestyle Pro on Genesis Framework · WordPress · Log in

Go to mobile version