

In this tutorial, we will see examples of using element_blank() to control the look of non-data aspects of a plot made with ggplot2. This is fourth in the series of understanding how to change four different elements of ggplot2’s theme systems.
- element_text()
- element_line()
- element_rect()
- element_blank()
We saw how to use element_text() to change the looks of text in a plot, how to use element_line() to change line elements of a plot and how to use element_rect() to customize the rectangular elements of a plot made with ggplot2. Here we will take a look at the fourth and final ggplot2’s theme element, element_blank().
What does element_blank() do?
If you look at the ggplot2′ theme documentation page, you can see that element_blank() does not take any arguments. So what does it do? As it says element_blank()
draws nothing, and assigns no space.
We can use element_blank() if we don’t want any specific non-data plot elements drawn on the plot. In the three posts, we saw 32 tips in total to customize three ggplot2 theme elements. With element_blank() we can suppress or remove change each one of them.
In this tutorial, we will first make scatter plot with default theme, but with legend, tag and caption. Then we will show how can we use element_blank() to suppress some the elements of the plot. At first, we will remove one element at time to illustrate the use of element_blank and then finally suppress multiple elements of the plot using element_blank for each feature of the plot. As the plot below shows, we will focus on just a few elements of the plot and use element_blank to remove it from the plot.


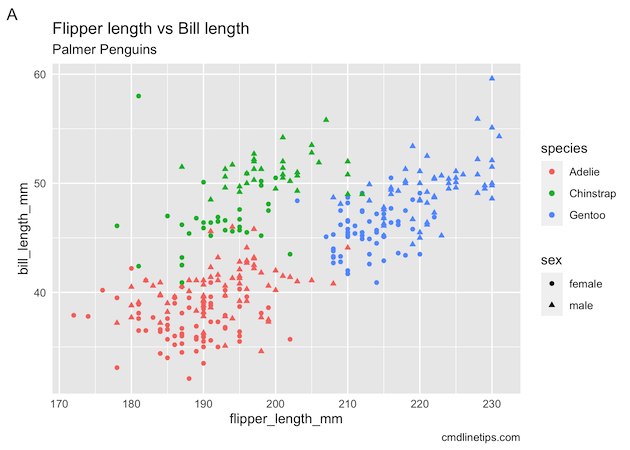
Scatter plot with default ggplot2 theme elements
Let us use Palmer Penguins data to make a scatter plot with default ggplot2 theme, but with legend, title, subtitle, caption and tag to annotate the plot.
library(tidyverse)
library(palmerpenguins)
We will store the plot as a variable and use the variable to modify the plot using element_blank for various options.
p <- penguins %>%
  drop_na() %>%
  ggplot(aes(x=flipper_length_mm,
             y=bill_length_mm,
             color=species,
             shape=sex))+
  geom_point()+
  labs(title="Flipper length vs Bill length",
       subtitle="Palmer Penguins",
       caption="cmdlinetips.com",
       tag="A")

p
ggsave("scatterplot_ggplot2_default.png")


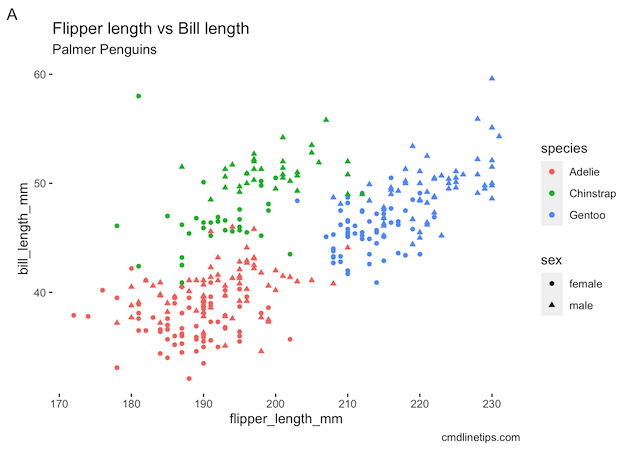
Remove Major Grid Lines with element_blank()
To remove or suppress the major grid lines we see in the default scatter plot, we can specify panel.grid.major argument to element_blank().
p + theme(panel.grid.major=element_blank())
ggsave("remove_major_grid_lines_with_element_blank_ggplot2_theme.png")

Remove Minor Grid Lines with element_blank()
Similarly, to remove or suppress the minor grid lines we see in the default scatter plot, we use element blank with panel.grid.minor.
# Remove Minor Grid Lines
p + theme(panel.grid.minor=element_blank())
ggsave("remove_minor_grid_lines_with_element_blank_ggplot2_theme.png")

Remove Panel Background with element_blank()
By default ggplot2 make the plot with grey background, we can remove the grey background, using panel.background=element_blank().
# Remove Panel Background
p + theme(panel.background = element_blank())
ggsave("remove_panel_background_with_element_blank_ggplot2_theme.png")
Remove Axis Ticks with element_blank()
# Remove Axis Ticks
p + theme(axis.ticks = element_blank())
ggsave("remove_axis_ticks_with_element_blank_ggplot2_theme.png")
Remove Axis Text with element_blank()
p + theme(axis.text = element_blank())
ggsave("remove_axis_text_label_with_element_blank_ggplot2_theme.png")

Remove Legend Key with element_blank()
# Remove Legend Key
p + theme(legend.key=element_blank())
ggsave("remove_legend_key_with_element_blank_ggplot2_theme.png")
Remove Multiple Theme Elements with element_blank()
p + theme(panel.background = element_blank(),
          axis.ticks = element_blank(),
          axis.text = element_blank(),
          legend.key=element_blank(),
          plot.tag=element_blank(),
          plot.caption=element_blank())
ggsave("remove_multiple_theme_elements_with_element_blank_ggplot2_theme.png")


