

Scatter plots are extremely useful to analyze the relationship between two quantitative variables in a data set. Often datasets contain multiple quantitative and categorical variables and may be interested in relationship between two quantitative variables with respect to a third categorical variable. And coloring scatter plots by the group/categorical variable will greatly enhance the scatter… Continue reading How To Specify Colors to Scatter Plots in Python
Category: Seaborn
How To Make Scatter Plot in Python with Seaborn?

Scatter plots are a useful visualization when you have two quantitative variables and want to understand the relationship between them. In this post we will see examples of making scatter plots using Seaborn in Python. We will first make a simple scatter plot and improve it iteratively. Let us first load the packages we need… Continue reading How To Make Scatter Plot in Python with Seaborn?
Catplot Python Seaborn: One Function to Rule All Plots With Categorical Variables


I just discovered catplot in Seaborn. Catplot is a relatively new addition to Seaborn that simplifies plotting that involves categorical variables. In Seaborn version v0.9.0 that came out in July 2018, changed the older factor plot to catplot to make it more consistent with terminology in pandas and in seaborn. The new catplot function provides… Continue reading Catplot Python Seaborn: One Function to Rule All Plots With Categorical Variables
How To Make Grouped Boxplots in Python with Seaborn?

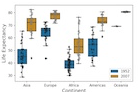
Boxplots are one of the most common ways to visualize data distributions from multiple groups. In Python, Seaborn potting library makes it easy to make boxplots and similar plots swarmplot and stripplot. Sometimes, your data might have multiple subgroups and you might want to visualize such data using grouped boxplots. Here, we will see examples… Continue reading How To Make Grouped Boxplots in Python with Seaborn?
How To Make Histogram in Python with Pandas and Seaborn?
Histograms are a great way to visualize the distributions of a single variable and it is one of the must for initial exploratory analysis with fewer variables. In Python, one can easily make histograms in many ways. Here we will see examples of making histogram with Pandas and Seaborn. Let us first load Pandas, pyplot… Continue reading How To Make Histogram in Python with Pandas and Seaborn?